Hoary-headed Grebe
Poliocephalus poliocephalus
ABR description
The following is extracted from the Annual Bird Report for the twelve months to June 2017.
Common, breeding resident
Prefers larger bodies of deeper water than the Australasian Grebe.
General: After an increase last year, this reporting period shows a decrease in all indices reflecting a general decline in numbers since the recent peak in 2012-13; abundance (0.,3 cf 0.65 last year) and reporting rate (2.9% cf 4.9% last year). Max 215/21 Aug LBath S Morass GrZ08 (LeM1), slightly down from 250 last year. Breeding indices similar to last year with 17 observations of dy plus 9 other records associated with breeding from 6 sites: Parkwood Rd GrH11, Briars Sharrow Rd Hoskinstown GrR16, BSP GrS13, Farm Dam Lakes Rd GrR12, LBath S Morass Gr08 and Mistletoe patch at Collector Road GrU07.

Abundance
Abundance is the average number of birds of that species per survey. Where the species was observed (presence recorded) but the number of birds seen was not recorded, this is treated as a count of zero.
Abundance by year
This chart shows the abundance of Hoary-headed Grebe between 1982 and 2017. 
Abundance by month
This chart shows the monthly abundance of Hoary-headed Grebe. The blue lines show the abundance for the twelve months to June 2017 and the bars show the average abundance for the period 1982 to 2017. 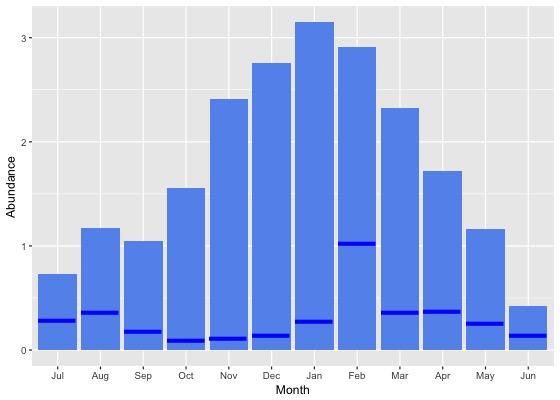
Abundance by season
This chart shows the seasonal abundance of Hoary-headed Grebe. The blue lines show the seasonal abundance for the twelve months to June 2017 and the bars show the average seasonal abundance for the period 1982 to 2017. 
Abundance data
| Month | Season | ||||||||||||||||||
|---|---|---|---|---|---|---|---|---|---|---|---|---|---|---|---|---|---|---|---|
| Period | Jul | Aug | Sep | Oct | Nov | Dec | Jan | Feb | Mar | Apr | May | Jun | Winter | Spring | Summer | Autumn | All | ||
| All years | |||||||||||||||||||
| All | 0.7 | 1.2 | 1.0 | 1.6 | 2.4 | 2.8 | 3.1 | 2.9 | 2.3 | 1.7 | 1.2 | 0.4 | 0.7 | 1.6 | 2.9 | 1.8 | 1.8 | ||
| Previous years | |||||||||||||||||||
| All previous years | 0.8 | 1.3 | 1.2 | 1.8 | 2.8 | 3.1 | 3.7 | 3.3 | 2.7 | 1.9 | 1.4 | 0.5 | 0.8 | 1.8 | 3.4 | 2.1 | 2.1 | ||
| Previous 30 years | 0.7 | 1.1 | 1.1 | 1.6 | 2.5 | 2.7 | 3.4 | 2.4 | 2.4 | 1.6 | 1.2 | 0.4 | 0.7 | 1.7 | 2.9 | 1.8 | 1.8 | ||
| Previous 20 years | 0.4 | 0.6 | 0.5 | 0.7 | 1.1 | 0.9 | 1.2 | 0.8 | 0.7 | 0.6 | 0.7 | 0.3 | 0.4 | 0.7 | 1.0 | 0.6 | 0.7 | ||
| 10 year groups | |||||||||||||||||||
| [2007,2017) | 0.6 | 0.5 | 0.5 | 0.5 | 0.7 | 0.8 | 1.1 | 0.9 | 0.7 | 0.7 | 0.9 | 0.3 | 0.4 | 0.6 | 1.0 | 0.7 | 0.7 | ||
| [1997,2007) | 0.2 | 0.9 | 0.6 | 1.3 | 1.7 | 1.1 | 1.3 | 0.7 | 0.7 | 0.3 | 0.2 | 0.1 | 0.4 | 1.2 | 1.0 | 0.4 | 0.8 | ||
| [1987,1997) | 1.8 | 2.5 | 3.8 | 7.3 | 7.4 | 12.9 | 16.5 | 9.8 | 12.0 | 6.8 | 3.5 | 1.1 | 1.8 | 6.3 | 13.2 | 7.5 | 7.1 | ||
| 5 year groups | |||||||||||||||||||
| [2012,2017) | 0.7 | 0.5 | 0.6 | 0.7 | 0.9 | 0.8 | 1.2 | 1.0 | 0.9 | 0.9 | 1.1 | 0.5 | 0.5 | 0.7 | 1.0 | 0.9 | 0.8 | ||
| [2007,2012) | 0.3 | 0.4 | 0.3 | 0.2 | 0.3 | 0.6 | 1.1 | 0.4 | 0.1 | 0.2 | 0.2 | 0.1 | 0.2 | 0.2 | 0.7 | 0.2 | 0.3 | ||
| [2002,2007) | 0.2 | 0.6 | 0.5 | 0.9 | 0.2 | 0.1 | 1.5 | 0.9 | 0.3 | 0.3 | 0.3 | 0.1 | 0.3 | 0.6 | 0.7 | 0.3 | 0.5 | ||
| [1997,2002) | 0.0 | 1.3 | 0.7 | 1.9 | 3.6 | 2.3 | 1.0 | 0.5 | 1.1 | 0.2 | 0.0 | 0.3 | 0.5 | 1.9 | 1.4 | 0.5 | 1.2 | ||
| [1992,1997) | 5.1 | 6.3 | 10.8 | 19.3 | 21.5 | 32.9 | 33.0 | 20.1 | 23.4 | 8.4 | 6.8 | 1.7 | 4.4 | 17.7 | 29.4 | 13.2 | 15.8 | ||
| [1987,1992) | 0.3 | 0.5 | 0.6 | 0.7 | 0.7 | 4.2 | 7.4 | 5.9 | 5.1 | 5.9 | 1.8 | 0.7 | 0.5 | 0.6 | 5.8 | 4.3 | 2.7 | ||
| Year | |||||||||||||||||||
| 2017 | 0.3 | 0.4 | 0.2 | 0.1 | 0.1 | 0.1 | 0.3 | 1.0 | 0.4 | 0.4 | 0.3 | 0.1 | 0.3 | 0.1 | 0.5 | 0.3 | 0.3 | ||
| 2016 | 0.6 | 0.5 | 0.6 | 0.5 | 0.7 | 0.7 | 0.8 | 0.7 | 0.6 | 0.5 | 1.4 | 0.4 | 0.5 | 0.6 | 0.7 | 0.8 | 0.7 | ||
| 2015 | 0.2 | 0.4 | 0.3 | 0.7 | 1.0 | 1.0 | 0.4 | 0.1 | 0.2 | 0.2 | 0.3 | 0.2 | 0.2 | 0.7 | 0.5 | 0.2 | 0.4 | ||
| 2014 | 1.2 | 0.6 | 1.0 | 1.1 | 0.9 | 1.1 | 2.5 | 1.8 | 1.5 | 0.9 | 0.7 | 0.5 | 0.7 | 1.0 | 2.0 | 1.1 | 1.3 | ||
| 2013 | 2.3 | 1.2 | 1.3 | 1.2 | 1.6 | 1.0 | 2.3 | 3.4 | 2.5 | 1.7 | 1.2 | 0.5 | 1.2 | 1.4 | 2.0 | 2.0 | 1.7 | ||
| 2012 | 0.1 | 0.1 | 0.2 | 0.2 | 0.2 | 0.6 | 0.4 | 0.2 | 0.4 | 2.5 | 2.2 | 1.1 | 0.5 | 0.2 | 0.4 | 1.7 | 0.6 | ||
| 2011 | 0.0 | 0.0 | 0.1 | 0.0 | 0.0 | 0.1 | 0.2 | 0.2 | 0.0 | 0.1 | 0.1 | 0.0 | 0.0 | 0.0 | 0.2 | 0.1 | 0.1 | ||
| 2010 | 0.2 | 0.0 | 1.0 | 0.1 | 0.3 | 1.8 | 1.8 | 0.0 | 0.0 | 0.0 | 0.0 | 0.0 | 0.0 | 0.4 | 1.6 | 0.0 | 0.5 | ||
| 2009 | 0.7 | 0.1 | 0.2 | 0.1 | 0.0 | 0.0 | 0.6 | 0.4 | 0.0 | 0.0 | 0.2 | 0.0 | 0.2 | 0.1 | 0.3 | 0.1 | 0.1 | ||
| 2008 | 0.0 | 2.1 | 0.3 | 0.2 | 0.4 | 0.0 | 0.1 | 0.0 | 0.0 | 0.0 | 0.0 | 0.0 | 0.5 | 0.2 | 0.0 | 0.0 | 0.2 | ||
| 2007 | 0.8 | 0.0 | 0.0 | 0.5 | 1.1 | 0.7 | 2.5 | 1.4 | 0.6 | 1.0 | 1.0 | 0.2 | 0.3 | 0.5 | 1.5 | 0.8 | 0.8 | ||
| 2006 | 0.0 | 0.3 | 0.7 | 0.5 | 0.0 | 0.2 | 1.3 | 0.0 | 0.2 | 0.0 | 0.0 | 0.1 | 0.1 | 0.5 | 0.5 | 0.1 | 0.3 | ||
| 2005 | 0.8 | 0.0 | 0.6 | 0.2 | 0.6 | 0.0 | 1.7 | 1.4 | 0.6 | 0.1 | 0.1 | 0.0 | 0.2 | 0.5 | 0.8 | 0.3 | 0.4 | ||
| 2004 | 0.1 | 1.3 | 0.2 | 1.9 | 0.3 | 0.5 | 0.3 | 1.8 | 0.7 | 0.6 | 0.4 | 0.1 | 0.4 | 0.8 | 0.7 | 0.6 | 0.6 | ||
| 2003 | 0.6 | 0.9 | 0.2 | 0.1 | 0.0 | 0.0 | 1.8 | 0.2 | 0.1 | 0.4 | 0.8 | 0.0 | 0.5 | 0.1 | 0.5 | 0.4 | 0.4 | ||
| 2002 | 0.0 | 0.1 | 0.8 | 2.1 | 0.0 | 0.0 | 2.4 | 1.4 | 0.1 | 0.5 | 0.1 | 0.1 | 0.1 | 1.0 | 0.9 | 0.2 | 0.6 | ||
| 2001 | 0.0 | 0.0 | 0.0 | 0.0 | 0.0 | 0.0 | 0.6 | 0.5 | 0.1 | 0.3 | 0.0 | 0.0 | 0.0 | 0.0 | 0.3 | 0.1 | 0.1 | ||
| 2000 | 0.0 | 0.3 | 0.0 | 0.3 | 1.9 | 1.3 | 1.1 | 0.2 | 0.0 | 0.1 | 0.0 | 0.0 | 0.1 | 0.7 | 0.9 | 0.0 | 0.5 | ||
| 1999 | 0.0 | 4.0 | 0.3 | 0.2 | 0.0 | 4.2 | 0.3 | 0.9 | 4.6 | 0.2 | 0.1 | 0.8 | 1.6 | 0.2 | 1.9 | 1.7 | 1.3 | ||
| 1998 | 0.0 | 4.9 | 3.4 | 6.4 | 16.3 | 9.7 | 3.8 | 0.2 | 1.2 | 1.3 | 0.0 | 0.0 | 1.6 | 8.7 | 5.7 | 1.0 | 5.2 | ||
| 1997 | 0.1 | 0.2 | 1.5 | 10.5 | 4.4 | 0.9 | 1.1 | 1.4 | 0.6 | 0.0 | 0.0 | 0.5 | 0.3 | 4.9 | 1.1 | 0.1 | 1.9 | ||
| 1996 | 0.1 | 8.1 | 4.2 | 5.3 | 28.1 | 25.5 | 31.9 | 10.2 | 1.3 | 2.6 | 1.2 | 0.1 | 3.1 | 13.3 | 23.3 | 1.6 | 11.1 | ||
| 1995 | 6.3 | 3.0 | 5.2 | 6.0 | 12.8 | 28.7 | 22.4 | 0.0 | 14.8 | 4.5 | 9.2 | 1.0 | 3.4 | 7.8 | 19.1 | 9.1 | 9.4 | ||
| 1994 | 13.6 | 15.9 | 36.0 | 23.5 | 25.9 | 19.8 | 59.9 | 10.2 | 32.0 | 10.9 | 10.0 | 1.0 | 9.2 | 27.6 | 32.4 | 16.9 | 21.1 | ||
| 1993 | 3.3 | 3.4 | 6.1 | 39.6 | 6.0 | 73.4 | 46.8 | 7.9 | 30.0 | 3.5 | 4.5 | 5.1 | 4.0 | 18.5 | 46.6 | 13.7 | 18.1 | ||
| 1992 | 3.3 | 1.8 | 6.7 | 39.4 | 30.7 | 30.6 | 12.2 | 95.3 | 49.0 | 22.1 | 7.5 | 2.5 | 2.6 | 25.8 | 40.4 | 26.0 | 23.6 | ||
| 1991 | 0.8 | 0.2 | 1.0 | 0.4 | 4.9 | 30.1 | 57.5 | 29.2 | 21.8 | 20.0 | 11.2 | 4.0 | 1.2 | 2.1 | 38.4 | 17.7 | 12.0 | ||
| 1990 | 0.4 | 0.3 | 0.8 | 1.3 | 0.9 | 3.6 | 11.9 | 24.6 | 11.6 | 30.4 | 1.1 | 0.1 | 0.3 | 1.0 | 13.3 | 14.9 | 5.9 | ||
| 1989 | 0.1 | 0.6 | 0.2 | 0.5 | 0.3 | 1.0 | 3.6 | 2.6 | 6.5 | 0.7 | 0.6 | 1.1 | 0.6 | 0.4 | 2.3 | 2.6 | 1.4 | ||
| 1988 | 0.1 | 0.1 | 1.2 | 0.8 | 0.2 | 1.1 | 0.3 | 1.9 | 0.2 | 1.6 | 2.0 | 0.2 | 0.1 | 0.6 | 1.0 | 1.3 | 0.7 | ||
| 1987 | 0.5 | 9.5 | 0.2 | 0.5 | 0.1 | 1.7 | 2.1 | 1.0 | 1.0 | 1.5 | 0.0 | 0.4 | 1.0 | 0.3 | 1.6 | 0.9 | 0.8 | ||
| 1986 | 0.1 | 4.3 | 2.7 | 7.3 | 2.4 | 9.3 | 20.0 | 17.9 | 11.6 | 7.1 | 1.1 | 1.5 | 2.2 | 3.8 | 15.3 | 6.8 | 6.6 | ||
| 1985 | 2.5 | 0.7 | 4.3 | 8.6 | 12.7 | 12.0 | 92.9 | 87.7 | 53.0 | 81.5 | 9.4 | 1.6 | 1.6 | 8.7 | 34.8 | 55.6 | 17.2 | ||
| 1984 | 26.2 | 8.9 | 23.0 | 7.8 | 17.5 | 16.8 | 2.8 | 3.2 | 0.0 | 11.8 | 8.3 | 5.3 | 8.1 | 13.2 | 5.3 | 7.2 | 7.3 | ||
| 1983 | 21.7 | 52.9 | 62.0 | 35.0 | 117.4 | 34.8 | 161.2 | 165.1 | 694.0 | - | 32.5 | 6.6 | 28.9 | 67.5 | 107.9 | 127.0 | 76.7 | ||
| 1982 | - | 29.9 | - | 0.0 | 2.6 | 151.3 | - | 130.1 | - | 37.6 | - | 14.5 | 21.3 | 2.3 | 142.0 | 37.6 | 63.8 | ||
Reporting rates
Reporting rate is the proportion of all surveys in which the species was present.
Reporting rate by year
This chart shows the reporting rate of Hoary-headed Grebe each year between 1982 and 2017. 
Reporting rate by month
This chart shows the reporting rate by month of Hoary-headed Grebe. The blue lines show the reporting rate for the twelve months to June 2017 and the bars show the average reporting rate for the period 1982 to 2017. 
Reporting rate by season
This chart shows the seasonal reporting rate of Hoary-headed Grebe. The blue lines show the seasonal reporting rate for the twelve months to June 2017 and the bars show the average seasonal reporting rate for the period 1982 to 2017. 
Reporting rate data
| Month | Season | ||||||||||||||||||
|---|---|---|---|---|---|---|---|---|---|---|---|---|---|---|---|---|---|---|---|
| Period | Jul | Aug | Sep | Oct | Nov | Dec | Jan | Feb | Mar | Apr | May | Jun | Winter | Spring | Summer | Autumn | All | ||
| All years | |||||||||||||||||||
| All | 4.9 | 4.6 | 3.1 | 3.8 | 3.9 | 3.7 | 5.4 | 5.4 | 3.3 | 4.1 | 4.9 | 3.4 | 4.2 | 3.6 | 4.8 | 4.0 | 4.1 | ||
| Previous years | |||||||||||||||||||
| All previous years | 4.9 | 5.2 | 3.4 | 4.3 | 4.3 | 4.1 | 6.0 | 5.0 | 3.3 | 4.0 | 5.2 | 3.6 | 4.5 | 4.0 | 5.0 | 4.0 | 4.4 | ||
| Previous 30 years | 4.7 | 4.6 | 3.3 | 4.0 | 4.1 | 3.8 | 5.8 | 4.5 | 3.2 | 3.6 | 5.0 | 3.1 | 4.0 | 3.8 | 4.7 | 3.8 | 4.1 | ||
| Previous 20 years | 4.1 | 4.4 | 3.1 | 3.8 | 3.9 | 3.2 | 5.5 | 4.0 | 2.8 | 2.7 | 4.5 | 2.6 | 3.6 | 3.6 | 4.3 | 3.2 | 3.7 | ||
| 10 year groups | |||||||||||||||||||
| [2007,2017) | 5.3 | 4.9 | 3.3 | 3.6 | 4.7 | 3.9 | 5.8 | 4.4 | 2.9 | 2.9 | 5.4 | 3.3 | 4.3 | 3.8 | 4.8 | 3.5 | 4.1 | ||
| [1997,2007) | 2.1 | 3.3 | 2.5 | 4.4 | 2.3 | 1.8 | 4.5 | 3.0 | 2.5 | 2.2 | 2.4 | 1.1 | 2.0 | 3.1 | 2.9 | 2.4 | 2.6 | ||
| [1987,1997) | 6.8 | 5.0 | 4.3 | 5.6 | 4.9 | 6.9 | 7.8 | 6.8 | 5.7 | 8.3 | 6.6 | 5.5 | 5.7 | 5.0 | 7.2 | 6.9 | 6.1 | ||
| 5 year groups | |||||||||||||||||||
| [2012,2017) | 6.7 | 6.1 | 3.9 | 4.8 | 5.8 | 5.1 | 6.3 | 5.1 | 3.7 | 3.8 | 6.3 | 4.6 | 5.7 | 4.8 | 5.6 | 4.4 | 5.1 | ||
| [2007,2012) | 1.5 | 0.7 | 2.1 | 1.6 | 1.7 | 1.4 | 3.9 | 1.5 | 0.7 | 1.0 | 3.1 | 0.9 | 1.0 | 1.7 | 2.3 | 1.3 | 1.6 | ||
| [2002,2007) | 2.8 | 3.9 | 3.1 | 5.7 | 2.4 | 1.6 | 4.8 | 2.6 | 3.0 | 2.4 | 2.9 | 1.2 | 2.4 | 3.9 | 2.7 | 2.8 | 3.0 | ||
| [1997,2002) | 1.0 | 2.7 | 1.9 | 2.5 | 2.2 | 2.1 | 4.2 | 3.5 | 1.9 | 1.9 | 1.7 | 0.9 | 1.5 | 2.2 | 3.1 | 1.9 | 2.2 | ||
| [1992,1997) | 12.0 | 6.2 | 6.6 | 8.4 | 7.7 | 9.1 | 11.5 | 6.8 | 7.7 | 9.1 | 8.4 | 6.5 | 8.0 | 7.7 | 9.4 | 8.4 | 8.3 | ||
| [1987,1992) | 4.4 | 4.3 | 3.2 | 4.1 | 3.5 | 6.0 | 5.8 | 6.8 | 4.4 | 7.8 | 5.6 | 5.0 | 4.5 | 3.6 | 6.2 | 6.0 | 5.0 | ||
| Year | |||||||||||||||||||
| 2017 | 4.4 | 1.9 | 0.8 | 0.6 | 1.3 | 1.4 | 2.4 | 7.3 | 3.2 | 4.7 | 3.9 | 2.6 | 2.8 | 0.8 | 3.7 | 3.9 | 2.9 | ||
| 2016 | 8.4 | 6.6 | 3.9 | 4.7 | 3.9 | 4.7 | 5.9 | 4.5 | 3.6 | 4.9 | 6.0 | 3.0 | 5.9 | 4.3 | 5.1 | 4.7 | 4.9 | ||
| 2015 | 6.1 | 6.0 | 5.1 | 7.4 | 8.0 | 5.3 | 4.0 | 2.0 | 2.3 | 1.7 | 7.3 | 4.7 | 5.4 | 6.9 | 3.8 | 3.5 | 4.9 | ||
| 2014 | 6.1 | 5.9 | 3.4 | 4.4 | 3.7 | 5.3 | 8.3 | 10.1 | 5.1 | 4.1 | 4.8 | 5.7 | 5.9 | 3.9 | 8.2 | 4.7 | 5.8 | ||
| 2013 | 8.2 | 7.7 | 4.1 | 3.3 | 7.9 | 4.6 | 9.9 | 6.2 | 5.1 | 5.3 | 6.3 | 6.5 | 7.4 | 4.8 | 6.9 | 5.5 | 6.0 | ||
| 2012 | 2.4 | 3.5 | 2.0 | 2.9 | 5.2 | 6.2 | 5.1 | 6.8 | 3.0 | 1.9 | 6.4 | 5.1 | 3.8 | 3.2 | 5.8 | 3.3 | 4.0 | ||
| 2011 | 0.0 | 0.0 | 1.2 | 0.4 | 1.2 | 1.8 | 1.2 | 1.4 | 0.0 | 0.3 | 2.9 | 1.5 | 0.8 | 0.8 | 1.5 | 1.0 | 1.0 | ||
| 2010 | 2.1 | 0.0 | 4.5 | 2.1 | 1.4 | 2.2 | 6.3 | 0.0 | 0.4 | 0.0 | 0.0 | 0.8 | 0.8 | 2.6 | 3.4 | 0.2 | 1.9 | ||
| 2009 | 2.2 | 3.1 | 1.5 | 1.5 | 0.4 | 0.5 | 5.3 | 1.7 | 1.4 | 1.2 | 5.3 | 1.4 | 2.0 | 1.3 | 2.4 | 2.2 | 1.8 | ||
| 2008 | 0.7 | 0.9 | 1.1 | 1.9 | 3.4 | 0.0 | 3.2 | 1.9 | 0.0 | 1.2 | 3.6 | 0.0 | 0.4 | 1.9 | 1.3 | 1.3 | 1.4 | ||
| 2007 | 3.3 | 0.0 | 2.1 | 2.0 | 2.7 | 2.0 | 5.1 | 2.6 | 1.7 | 2.1 | 3.3 | 0.7 | 1.0 | 2.2 | 3.3 | 2.2 | 2.2 | ||
| 2006 | 0.7 | 1.0 | 2.2 | 2.6 | 1.8 | 1.1 | 6.2 | 0.7 | 4.4 | 1.1 | 2.9 | 0.8 | 0.8 | 2.3 | 2.8 | 3.2 | 2.3 | ||
| 2005 | 3.7 | 1.9 | 2.6 | 3.3 | 3.4 | 0.0 | 2.8 | 2.2 | 3.5 | 1.6 | 4.0 | 0.0 | 1.4 | 3.0 | 1.2 | 3.1 | 2.3 | ||
| 2004 | 4.4 | 7.9 | 5.3 | 11.6 | 2.3 | 1.8 | 2.4 | 5.1 | 1.6 | 2.7 | 2.9 | 1.8 | 4.6 | 6.3 | 2.7 | 2.3 | 4.1 | ||
| 2003 | 5.1 | 4.3 | 3.0 | 9.3 | 3.7 | 1.3 | 4.4 | 2.2 | 3.1 | 2.3 | 1.6 | 2.5 | 3.8 | 5.1 | 2.4 | 2.5 | 3.5 | ||
| 2002 | 0.0 | 2.5 | 2.5 | 5.6 | 1.0 | 2.9 | 7.5 | 3.3 | 1.4 | 4.2 | 2.4 | 1.6 | 1.3 | 3.2 | 4.2 | 2.5 | 2.9 | ||
| 2001 | 0.0 | 0.6 | 0.6 | 0.4 | 0.6 | 0.0 | 3.5 | 4.1 | 1.5 | 2.0 | 1.7 | 0.5 | 0.3 | 0.5 | 2.2 | 1.7 | 1.2 | ||
| 2000 | 0.8 | 1.3 | 1.4 | 1.3 | 2.3 | 2.0 | 4.5 | 2.9 | 0.4 | 0.9 | 1.8 | 0.0 | 0.6 | 1.7 | 3.1 | 0.9 | 1.7 | ||
| 1999 | 2.9 | 5.2 | 1.1 | 1.3 | 1.3 | 3.1 | 1.5 | 3.6 | 4.9 | 3.6 | 1.1 | 2.3 | 3.2 | 1.2 | 2.7 | 3.2 | 2.6 | ||
| 1998 | 0.0 | 5.7 | 4.1 | 6.5 | 5.3 | 3.8 | 10.3 | 1.9 | 1.1 | 2.6 | 7.4 | 0.0 | 1.8 | 5.2 | 5.3 | 2.5 | 4.1 | ||
| 1997 | 3.4 | 5.2 | 5.5 | 10.5 | 2.6 | 4.8 | 3.9 | 5.3 | 2.5 | 0.9 | 0.0 | 1.4 | 3.2 | 5.6 | 4.7 | 1.0 | 3.9 | ||
| 1996 | 4.5 | 7.4 | 2.7 | 3.5 | 6.5 | 7.1 | 10.7 | 5.9 | 2.9 | 4.7 | 13.8 | 4.6 | 5.6 | 4.4 | 8.0 | 6.2 | 6.1 | ||
| 1995 | 14.0 | 3.9 | 4.9 | 7.9 | 4.5 | 10.3 | 8.0 | 1.6 | 11.2 | 7.3 | 5.2 | 6.4 | 7.6 | 6.1 | 7.2 | 8.0 | 7.2 | ||
| 1994 | 11.8 | 9.1 | 5.9 | 8.1 | 5.1 | 8.7 | 17.6 | 5.2 | 6.8 | 9.2 | 5.0 | 3.4 | 7.4 | 6.2 | 11.0 | 7.4 | 7.7 | ||
| 1993 | 14.3 | 7.7 | 3.2 | 16.0 | 15.2 | 13.0 | 10.2 | 9.4 | 6.2 | 13.3 | 6.5 | 10.1 | 10.2 | 11.8 | 11.0 | 8.3 | 10.2 | ||
| 1992 | 15.4 | 3.7 | 15.3 | 9.6 | 12.5 | 7.9 | 13.8 | 17.1 | 12.7 | 13.6 | 13.2 | 10.0 | 10.1 | 12.4 | 12.3 | 13.1 | 12.0 | ||
| 1991 | 7.1 | 4.3 | 5.8 | 4.9 | 8.2 | 10.8 | 21.4 | 12.0 | 11.1 | 23.7 | 16.4 | 12.0 | 7.0 | 6.3 | 14.4 | 16.9 | 10.2 | ||
| 1990 | 7.1 | 2.7 | 4.3 | 4.1 | 4.7 | 15.3 | 8.3 | 12.7 | 8.0 | 10.7 | 9.6 | 3.9 | 4.6 | 4.4 | 12.1 | 9.4 | 6.9 | ||
| 1989 | 2.0 | 4.3 | 3.5 | 5.4 | 2.5 | 7.0 | 2.7 | 6.7 | 4.4 | 5.6 | 4.6 | 5.4 | 3.9 | 3.9 | 5.6 | 4.9 | 4.5 | ||
| 1988 | 2.6 | 4.1 | 3.4 | 3.9 | 3.1 | 3.1 | 4.0 | 2.9 | 2.0 | 9.1 | 3.5 | 5.3 | 4.0 | 3.5 | 3.3 | 4.8 | 3.9 | ||
| 1987 | 18.2 | 26.7 | 1.6 | 2.7 | 2.7 | 2.8 | 5.1 | 7.1 | 3.3 | 3.7 | 3.9 | 2.9 | 5.2 | 2.4 | 5.1 | 3.7 | 3.8 | ||
| 1986 | 7.7 | 18.4 | 11.3 | 22.2 | 8.5 | 23.5 | 13.0 | 19.4 | 16.1 | 9.8 | 3.4 | 11.4 | 13.1 | 13.2 | 19.4 | 9.9 | 13.7 | ||
| 1985 | 13.3 | 30.0 | 7.7 | 7.0 | 8.8 | 10.0 | 62.5 | 35.3 | 45.5 | 42.1 | 40.0 | 21.4 | 21.6 | 7.7 | 20.0 | 42.5 | 16.7 | ||
| 1984 | 60.0 | 40.0 | 60.0 | 50.0 | 50.0 | 41.7 | 13.8 | 15.2 | 0.0 | 26.5 | 16.1 | 41.2 | 42.9 | 52.4 | 18.9 | 15.2 | 25.4 | ||
| 1983 | 66.7 | 75.0 | 60.0 | 84.6 | 55.6 | 38.5 | 50.0 | 45.5 | 100.0 | - | 41.7 | 36.4 | 58.6 | 70.4 | 43.3 | 50.0 | 56.0 | ||
| 1982 | - | 54.5 | - | 0.0 | 12.5 | 35.7 | - | 63.6 | - | 61.5 | - | 78.6 | 68.0 | 11.1 | 48.0 | 61.5 | 52.8 | ||
Breeding data
Breeding records by month
Number of breeding records by breeding code and month, 2017 and all years| Breeding code | Jul | Aug | Sep | Oct | Nov | Dec | Jan | Feb | Mar | Apr | May | Jun |
|---|---|---|---|---|---|---|---|---|---|---|---|---|
| 2017 | ||||||||||||
| Breeding (BLA code) | 0 | 0 | 0 | 0 | 0 | 0 | 0 | 0 | 0 | 0 | 0 | 0 |
| Carrying Food | 0 | 0 | 0 | 0 | 0 | 0 | 0 | 0 | 0 | 0 | 0 | 0 |
| Copulating | 0 | 0 | 0 | 0 | 0 | 0 | 0 | 0 | 0 | 0 | 0 | 0 |
| Display | 0 | 0 | 0 | 0 | 0 | 0 | 0 | 0 | 0 | 0 | 0 | 0 |
| Dependent young | 0 | 0 | 0 | 0 | 0 | 1 | 4 | 11 | 1 | 0 | 0 | 0 |
| Faecal sac | 0 | 0 | 0 | 0 | 0 | 0 | 0 | 0 | 0 | 0 | 0 | 0 |
| Inspecting hollow | 0 | 0 | 0 | 0 | 0 | 0 | 0 | 0 | 0 | 0 | 0 | 0 |
| Nest building | 0 | 0 | 0 | 0 | 0 | 0 | 2 | 0 | 0 | 0 | 0 | 0 |
| Nest with eggs | 0 | 0 | 0 | 0 | 0 | 0 | 0 | 0 | 0 | 0 | 0 | 0 |
| Nest with young | 0 | 0 | 0 | 0 | 0 | 0 | 0 | 0 | 0 | 0 | 0 | 0 |
| On/leaving nest | 0 | 2 | 0 | 1 | 2 | 2 | 0 | 0 | 0 | 0 | 0 | 0 |
| All years | ||||||||||||
| Breeding (BLA code) | 0 | 0 | 0 | 1 | 0 | 0 | 0 | 0 | 0 | 1 | 0 | 0 |
| Carrying Food | 0 | 0 | 0 | 0 | 0 | 0 | 0 | 0 | 0 | 0 | 0 | 0 |
| Copulating | 0 | 0 | 0 | 0 | 0 | 0 | 0 | 0 | 0 | 0 | 0 | 0 |
| Display | 0 | 0 | 0 | 0 | 0 | 1 | 0 | 0 | 0 | 0 | 0 | 0 |
| Dependent young | 0 | 0 | 0 | 0 | 1 | 5 | 20 | 15 | 11 | 0 | 0 | 0 |
| Faecal sac | 0 | 0 | 0 | 0 | 0 | 0 | 0 | 0 | 0 | 0 | 0 | 0 |
| Inspecting hollow | 0 | 0 | 0 | 0 | 0 | 0 | 0 | 0 | 0 | 0 | 0 | 0 |
| Nest building | 0 | 0 | 0 | 0 | 1 | 2 | 2 | 0 | 1 | 0 | 0 | 0 |
| Nest with eggs | 0 | 0 | 0 | 2 | 0 | 3 | 0 | 0 | 0 | 0 | 1 | 0 |
| Nest with young | 0 | 0 | 0 | 0 | 0 | 0 | 0 | 0 | 0 | 0 | 0 | 0 |
| On/leaving nest | 0 | 2 | 0 | 2 | 4 | 8 | 2 | 1 | 0 | 1 | 0 | 1 |
Breeding records by year
Average number of breeding records per period by breeding code| Period | Breeding (BLA code) | Carrying Food | Copulating | Display | Dependent young | Faecal sac | Inspecting hollow | Nest building | Nest with eggs | Nest with young | On/leaving nest |
|---|---|---|---|---|---|---|---|---|---|---|---|
| All years | |||||||||||
| All | 0.1 | 0.0 | 0.0 | 0.0 | 1.4 | 0.0 | 0.0 | 0.2 | 0.2 | 0.0 | 0.6 |
| Previous years | |||||||||||
| All previous years | 0.1 | 0.0 | 0.0 | 0.0 | 1.0 | 0.0 | 0.0 | 0.1 | 0.2 | 0.0 | 0.4 |
| Previous 30 years | 0.1 | 0.0 | 0.0 | 0.0 | 1.2 | 0.0 | 0.0 | 0.1 | 0.2 | 0.0 | 0.4 |
| Previous 20 years | 0.0 | 0.0 | 0.0 | 0.0 | 1.4 | 0.0 | 0.0 | 0.1 | 0.0 | 0.0 | 0.5 |
| 10 year groups | |||||||||||
| [2007,2017) | 0.0 | 0.0 | 0.0 | 0.0 | 2.7 | 0.0 | 0.0 | 0.2 | 0.1 | 0.0 | 0.7 |
| [1997,2007) | 0.0 | 0.0 | 0.0 | 0.0 | 0.1 | 0.0 | 0.0 | 0.0 | 0.0 | 0.0 | 0.2 |
| [1987,1997) | 0.2 | 0.0 | 0.0 | 0.1 | 0.7 | 0.0 | 0.0 | 0.2 | 0.5 | 0.0 | 0.3 |
| 5 year groups | |||||||||||
| [2012,2017) | 0.0 | 0.0 | 0.0 | 0.0 | 5.4 | 0.0 | 0.0 | 0.4 | 0.2 | 0.0 | 1.2 |
| [2007,2012) | 0.0 | 0.0 | 0.0 | 0.0 | 0.0 | 0.0 | 0.0 | 0.0 | 0.0 | 0.0 | 0.2 |
| [2002,2007) | 0.0 | 0.0 | 0.0 | 0.0 | 0.0 | 0.0 | 0.0 | 0.0 | 0.0 | 0.0 | 0.4 |
| [1997,2002) | 0.0 | 0.0 | 0.0 | 0.0 | 0.2 | 0.0 | 0.0 | 0.0 | 0.0 | 0.0 | 0.0 |
| [1992,1997) | 0.4 | 0.0 | 0.0 | 0.2 | 0.2 | 0.0 | 0.0 | 0.0 | 0.0 | 0.0 | 0.2 |
| [1987,1992) | 0.0 | 0.0 | 0.0 | 0.0 | 1.2 | 0.0 | 0.0 | 0.4 | 1.0 | 0.0 | 0.4 |
| Year | |||||||||||
| 2017 | 0.0 | 0.0 | 0.0 | 0.0 | 17.0 | 0.0 | 0.0 | 2.0 | 0.0 | 0.0 | 7.0 |
| 2016 | 0.0 | 0.0 | 0.0 | 0.0 | 21.0 | 0.0 | 0.0 | 0.0 | 1.0 | 0.0 | 5.0 |
| 2015 | 0.0 | 0.0 | 0.0 | 0.0 | 4.0 | 0.0 | 0.0 | 1.0 | 0.0 | 0.0 | 0.0 |
| 2014 | 0.0 | 0.0 | 0.0 | 0.0 | 2.0 | 0.0 | 0.0 | 0.0 | 0.0 | 0.0 | 0.0 |
| 2013 | 0.0 | 0.0 | 0.0 | 0.0 | 0.0 | 0.0 | 0.0 | 0.0 | 0.0 | 0.0 | 0.0 |
| 2012 | 0.0 | 0.0 | 0.0 | 0.0 | 0.0 | 0.0 | 0.0 | 1.0 | 0.0 | 0.0 | 1.0 |
| 2011 | 0.0 | 0.0 | 0.0 | 0.0 | 0.0 | 0.0 | 0.0 | 0.0 | 0.0 | 0.0 | 1.0 |
| 2010 | 0.0 | 0.0 | 0.0 | 0.0 | 0.0 | 0.0 | 0.0 | 0.0 | 0.0 | 0.0 | 0.0 |
| 2009 | 0.0 | 0.0 | 0.0 | 0.0 | 0.0 | 0.0 | 0.0 | 0.0 | 0.0 | 0.0 | 0.0 |
| 2008 | 0.0 | 0.0 | 0.0 | 0.0 | 0.0 | 0.0 | 0.0 | 0.0 | 0.0 | 0.0 | 0.0 |
| 2007 | 0.0 | 0.0 | 0.0 | 0.0 | 0.0 | 0.0 | 0.0 | 0.0 | 0.0 | 0.0 | 0.0 |
| 2006 | 0.0 | 0.0 | 0.0 | 0.0 | 0.0 | 0.0 | 0.0 | 0.0 | 0.0 | 0.0 | 2.0 |
| 2005 | 0.0 | 0.0 | 0.0 | 0.0 | 0.0 | 0.0 | 0.0 | 0.0 | 0.0 | 0.0 | 0.0 |
| 2004 | 0.0 | 0.0 | 0.0 | 0.0 | 0.0 | 0.0 | 0.0 | 0.0 | 0.0 | 0.0 | 0.0 |
| 2003 | 0.0 | 0.0 | 0.0 | 0.0 | 0.0 | 0.0 | 0.0 | 0.0 | 0.0 | 0.0 | 0.0 |
| 2002 | 0.0 | 0.0 | 0.0 | 0.0 | 0.0 | 0.0 | 0.0 | 0.0 | 0.0 | 0.0 | 0.0 |
| 2001 | 0.0 | 0.0 | 0.0 | 0.0 | 0.0 | 0.0 | 0.0 | 0.0 | 0.0 | 0.0 | 0.0 |
| 2000 | 0.0 | 0.0 | 0.0 | 0.0 | 0.0 | 0.0 | 0.0 | 0.0 | 0.0 | 0.0 | 0.0 |
| 1999 | 0.0 | 0.0 | 0.0 | 0.0 | 1.0 | 0.0 | 0.0 | 0.0 | 0.0 | 0.0 | 0.0 |
| 1998 | 0.0 | 0.0 | 0.0 | 0.0 | 0.0 | 0.0 | 0.0 | 0.0 | 0.0 | 0.0 | 0.0 |
| 1997 | 0.0 | 0.0 | 0.0 | 0.0 | 0.0 | 0.0 | 0.0 | 0.0 | 0.0 | 0.0 | 0.0 |
| 1996 | 1.0 | 0.0 | 0.0 | 1.0 | 0.0 | 0.0 | 0.0 | 0.0 | 0.0 | 0.0 | 0.0 |
| 1995 | 1.0 | 0.0 | 0.0 | 0.0 | 0.0 | 0.0 | 0.0 | 0.0 | 0.0 | 0.0 | 0.0 |
| 1994 | 0.0 | 0.0 | 0.0 | 0.0 | 1.0 | 0.0 | 0.0 | 0.0 | 0.0 | 0.0 | 1.0 |
| 1993 | 0.0 | 0.0 | 0.0 | 0.0 | 0.0 | 0.0 | 0.0 | 0.0 | 0.0 | 0.0 | 0.0 |
| 1992 | 0.0 | 0.0 | 0.0 | 0.0 | 0.0 | 0.0 | 0.0 | 0.0 | 0.0 | 0.0 | 0.0 |
| 1991 | 0.0 | 0.0 | 0.0 | 0.0 | 2.0 | 0.0 | 0.0 | 0.0 | 0.0 | 0.0 | 1.0 |
| 1990 | 0.0 | 0.0 | 0.0 | 0.0 | 0.0 | 0.0 | 0.0 | 0.0 | 1.0 | 0.0 | 0.0 |
| 1989 | 0.0 | 0.0 | 0.0 | 0.0 | 0.0 | 0.0 | 0.0 | 1.0 | 3.0 | 0.0 | 1.0 |
| 1988 | 0.0 | 0.0 | 0.0 | 0.0 | 4.0 | 0.0 | 0.0 | 1.0 | 1.0 | 0.0 | 0.0 |
| 1987 | 0.0 | 0.0 | 0.0 | 0.0 | 0.0 | 0.0 | 0.0 | 0.0 | 0.0 | 0.0 | 0.0 |
| 1986 | 0.0 | 0.0 | 0.0 | 0.0 | 0.0 | 0.0 | 0.0 | 0.0 | 0.0 | 0.0 | 0.0 |
| 1985 | 0.0 | 0.0 | 0.0 | 0.0 | 0.0 | 0.0 | 0.0 | 0.0 | 0.0 | 0.0 | 0.0 |
| 1984 | 0.0 | 0.0 | 0.0 | 0.0 | 0.0 | 0.0 | 0.0 | 0.0 | 0.0 | 0.0 | 2.0 |
| 1983 | 0.0 | 0.0 | 0.0 | 0.0 | 0.0 | 0.0 | 0.0 | 0.0 | 0.0 | 0.0 | 0.0 |
| 1982 | 0.0 | 0.0 | 0.0 | 0.0 | 0.0 | 0.0 | 0.0 | 0.0 | 0.0 | 0.0 | 0.0 |
Distribution map
Distribution - 2017
This map shows the observed distribution of the Hoary-headed Grebe for 2017.
The red circles are the grid cells where Hoary-headed Grebe have been reported.
The transparency of the red circles indicate how many surveys sheets were submitted for that grid cell; the darker the red the more reliable the data. Of the 315 grid cells with reports, 83 had only one sheet; an example is grid number A11.
The size of the circle represents the reporting rate. The maximum reporting rate for Hoary-headed Grebe was 68.8% (eg grid number R12) and the minimum was 0.2% (eg grid number K14). 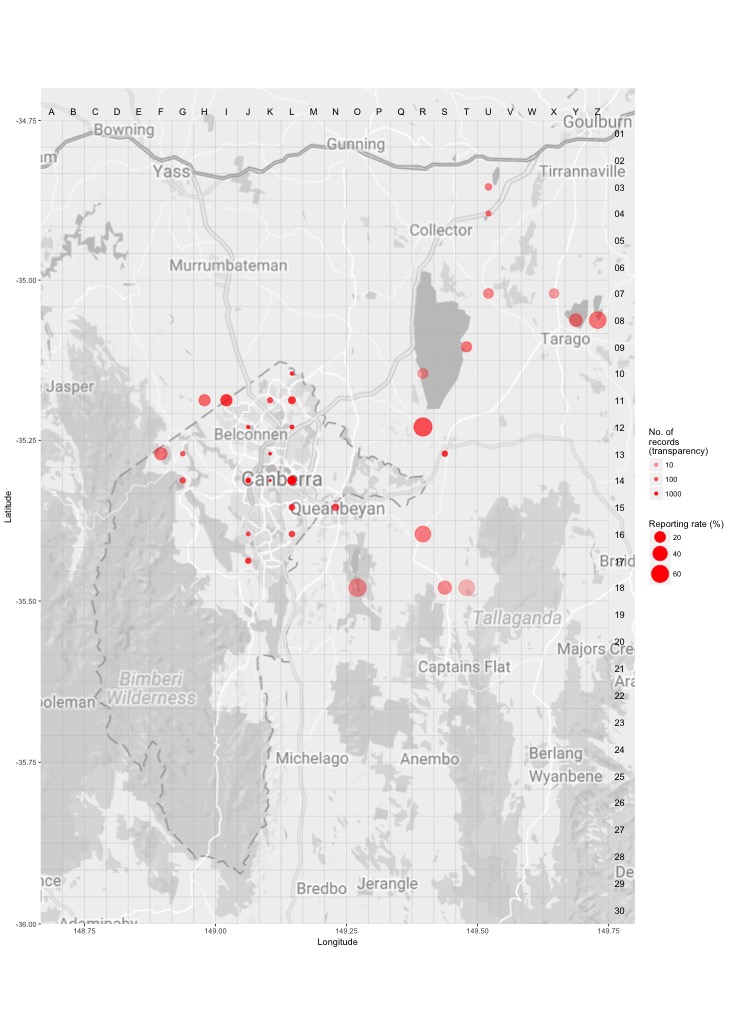
Distribution - all years
This map shows the observed distribution of the Hoary-headed Grebe for all years.
The red circles are the grid cells where Hoary-headed Grebe have been reported.
The transparency of the red circles indicate how many surveys sheets were submitted for that grid cell; the darker the red the more reliable the data. Of the 703 grid cells with reports, 55 had only one sheet; an example is grid number S27.
The size of the circle represents the reporting rate. The maximum reporting rate for Hoary-headed Grebe was 100.0% (eg grid number S27) and the minimum was 0.0% (eg grid number J13). 
Breeding map
Breeding - 2017
This map shows the breeding distribution of the Hoary-headed Grebe for 2017.
The red circles are the grid cells where breeding activity for Hoary-headed Grebe have been reported.
The size of the circle represents the number of reports. 
Breeding - all years
This map shows the breeding distribution of the Hoary-headed Grebe for all years.
The red circles are the grid cells where breeding activity for Hoary-headed Grebe have been reported.
The size of the circle represents the number of reports. 